1
Main Dashboard
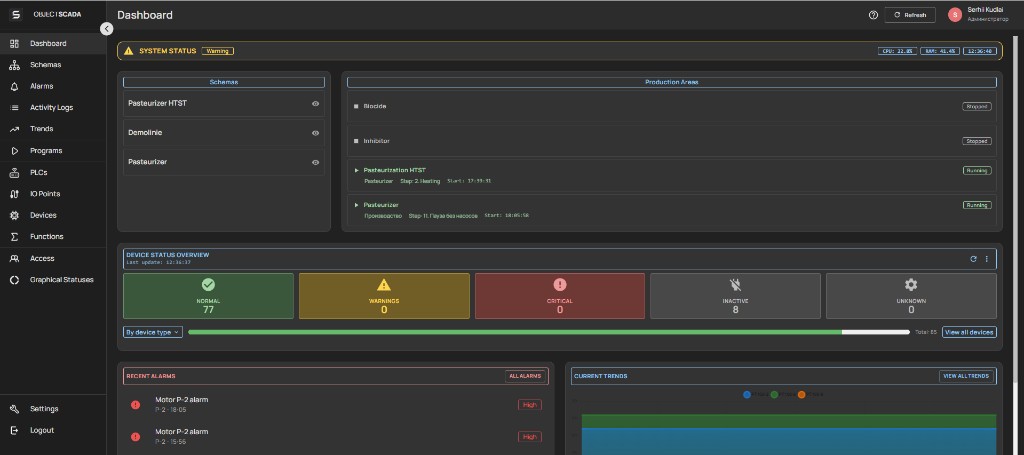
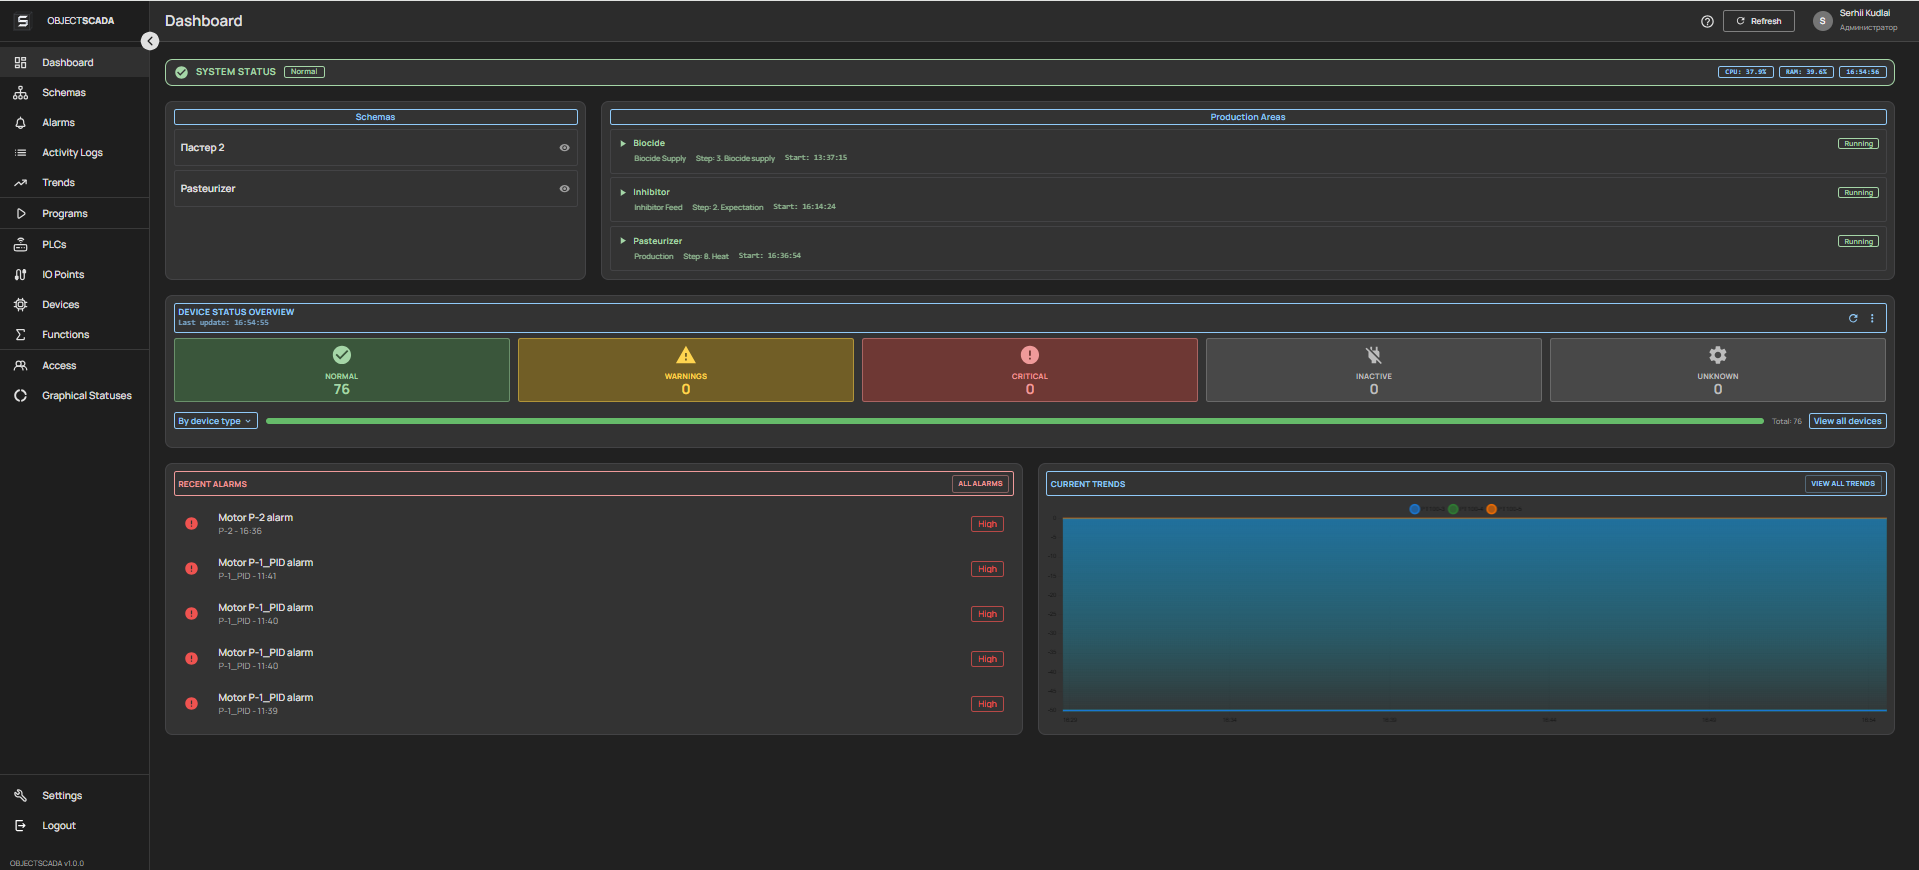
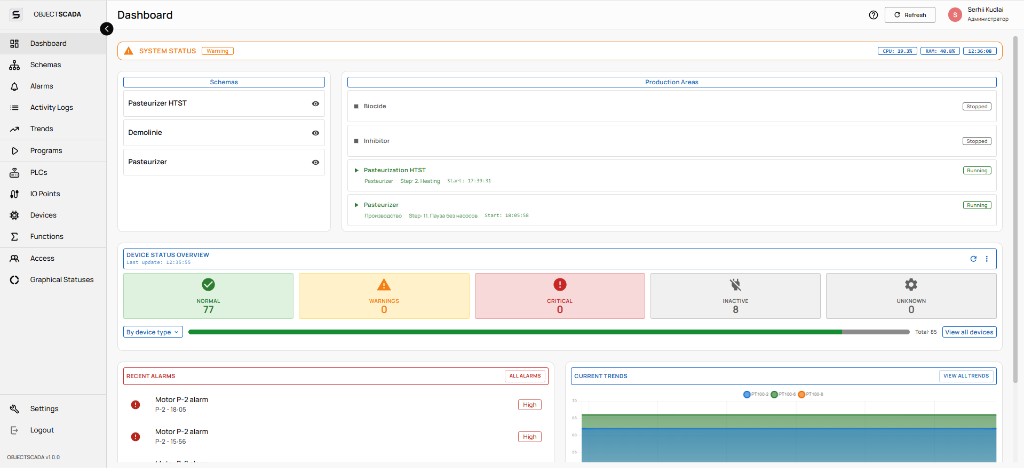
Overview monitoring screen: key KPIs, equipment status, real-time pressure and temperature trends.
Monitoring KPI WebSocket
Monitoring, control and automation of technological processes in real time. Supports all major PLC protocols, visual circuit editor and built-in AI assistant.
Full-featured SCADA platform with a single interface for monitoring, controlling and analyzing technological processes.
WebSocket connection provides instant data update. TimescaleDB stores time series with nanosecond precision.
Drag-and-drop flow chart editor based on Konva.js. Create interactive mimic diagrams with animation of device states.
Multi-level alarm system with priorities. Event log, acknowledgment, escalation of notifications. History of emergency situations.
Plotting historical data graphs with scaling. Export to Excel, CSV. Comparison of several parameters on one graph.
Visual programming of technological sequences. Management of recipes, stages and batches (batch automation).
Flexible RBAC system: operators, engineers, administrators. User activity log. JWT authentication.
Full localization via i18next. RTL (Arabic) support. Switch language without reloading the page.
Full containerization via Docker Compose. One file - the entire stack: backend, frontend, database, Redis, PLC worker.
Connect any industrial equipment without modification - the system supports standard protocols out of the box.
Snap7 + TIA Openness
Full support for S7-300/400/1200/1500. Read/write variables DB, M, I, Q. Integration with TIA Portal for automatic configuration deployment.
RTU / TCP / ASCII
Modbus RTU via RS-485/RS-232 and Modbus TCP/IP. Supports all function codes: Coils, Discrete Inputs, Holding Registers, Input Registers.
Broker / Client
IoT device protocol. Subscribe to topics, publish commands. Compatible with Mosquitto, HiveMQ, AWS IoT Core. QoS 0/1/2.
Client / Server
Industry standard IIoT. Secure data exchange with any OPC UA-compatible equipment. Support Node ID, Browse, Subscription.
Allen-Bradley / Rockwell
CIP protocol for Allen-Bradley PLCs. Supports ControlLogix, CompactLogix, MicroLogix. Tag reading, diagnostics.
Each component is optimized for its task - from the UI to the highly loaded Rust worker that works directly with the hardware.
Main application areas: from monitoring and diagrams to equipment and administration.
Five practical differences between our web platform and traditional client SCADA.
Screenshots of working SCADA installations at industrial facilities across various industries.
Overview monitoring screen: key KPIs, equipment status, real-time pressure and temperature trends.
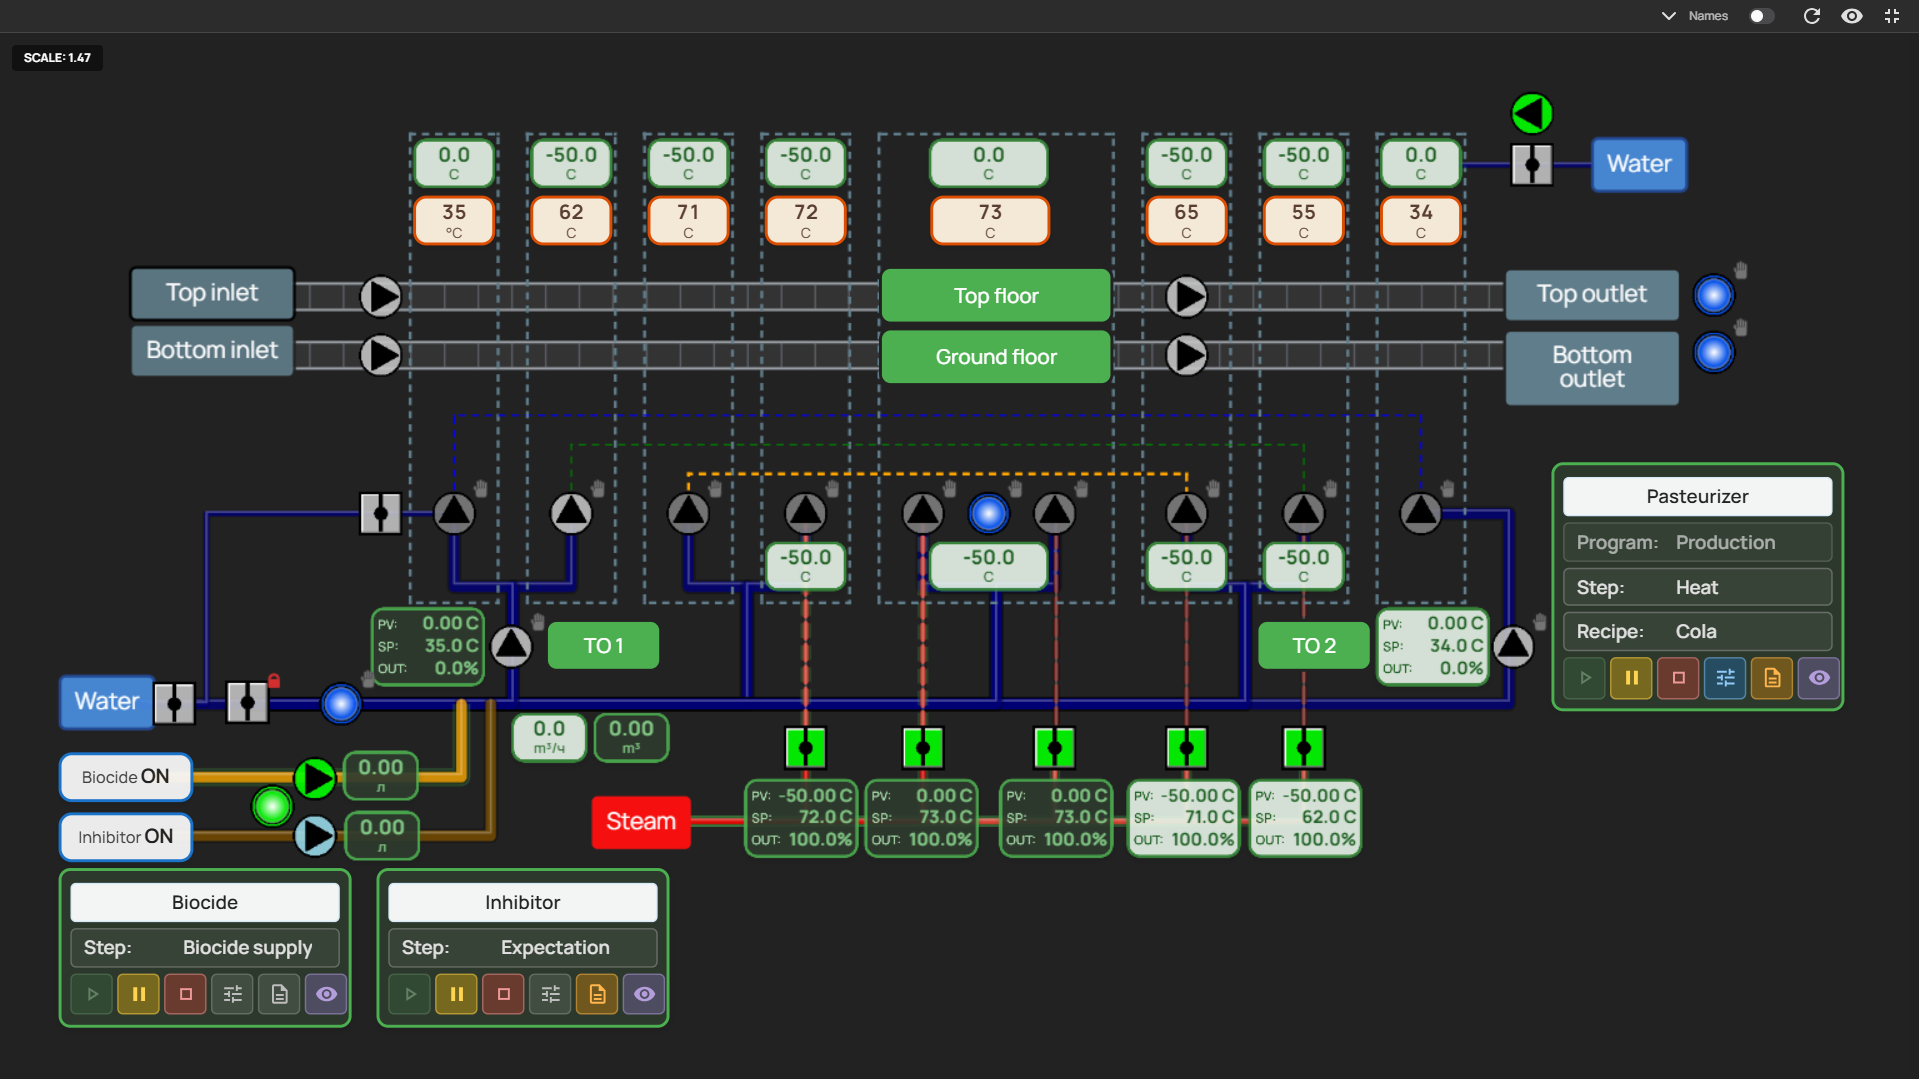
Interactive process diagram with animated devices, pipelines and valve states.
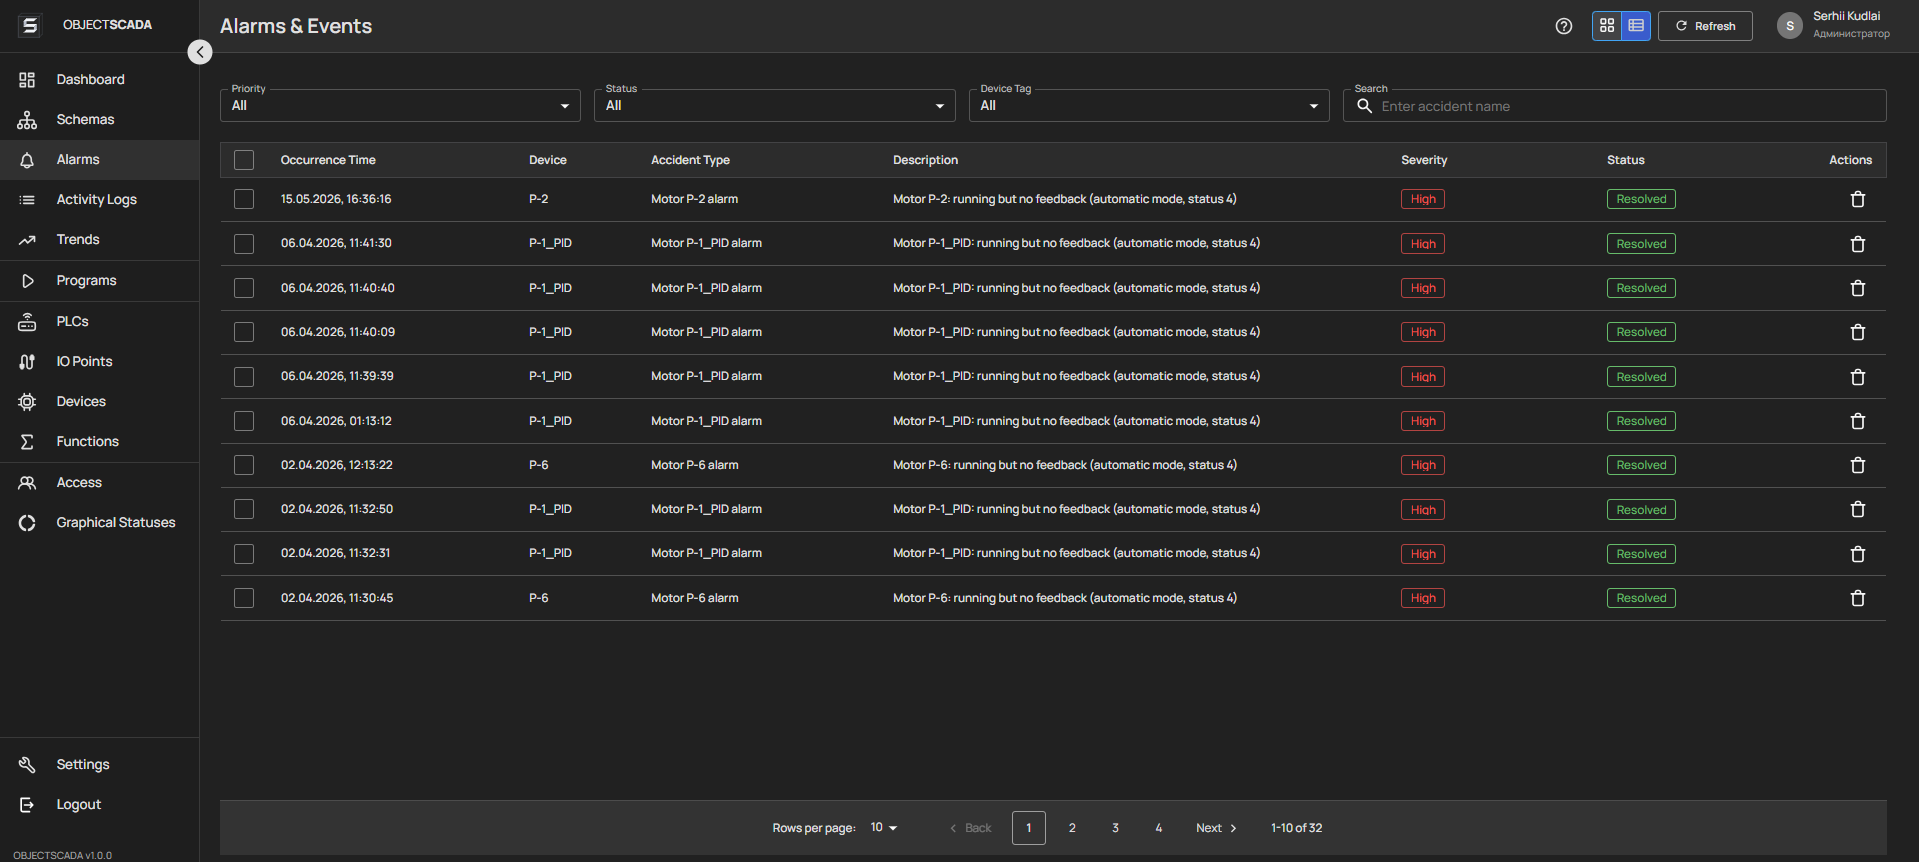
Alarm log with priorities, acknowledgment and history: filtering by zone, time and event type.
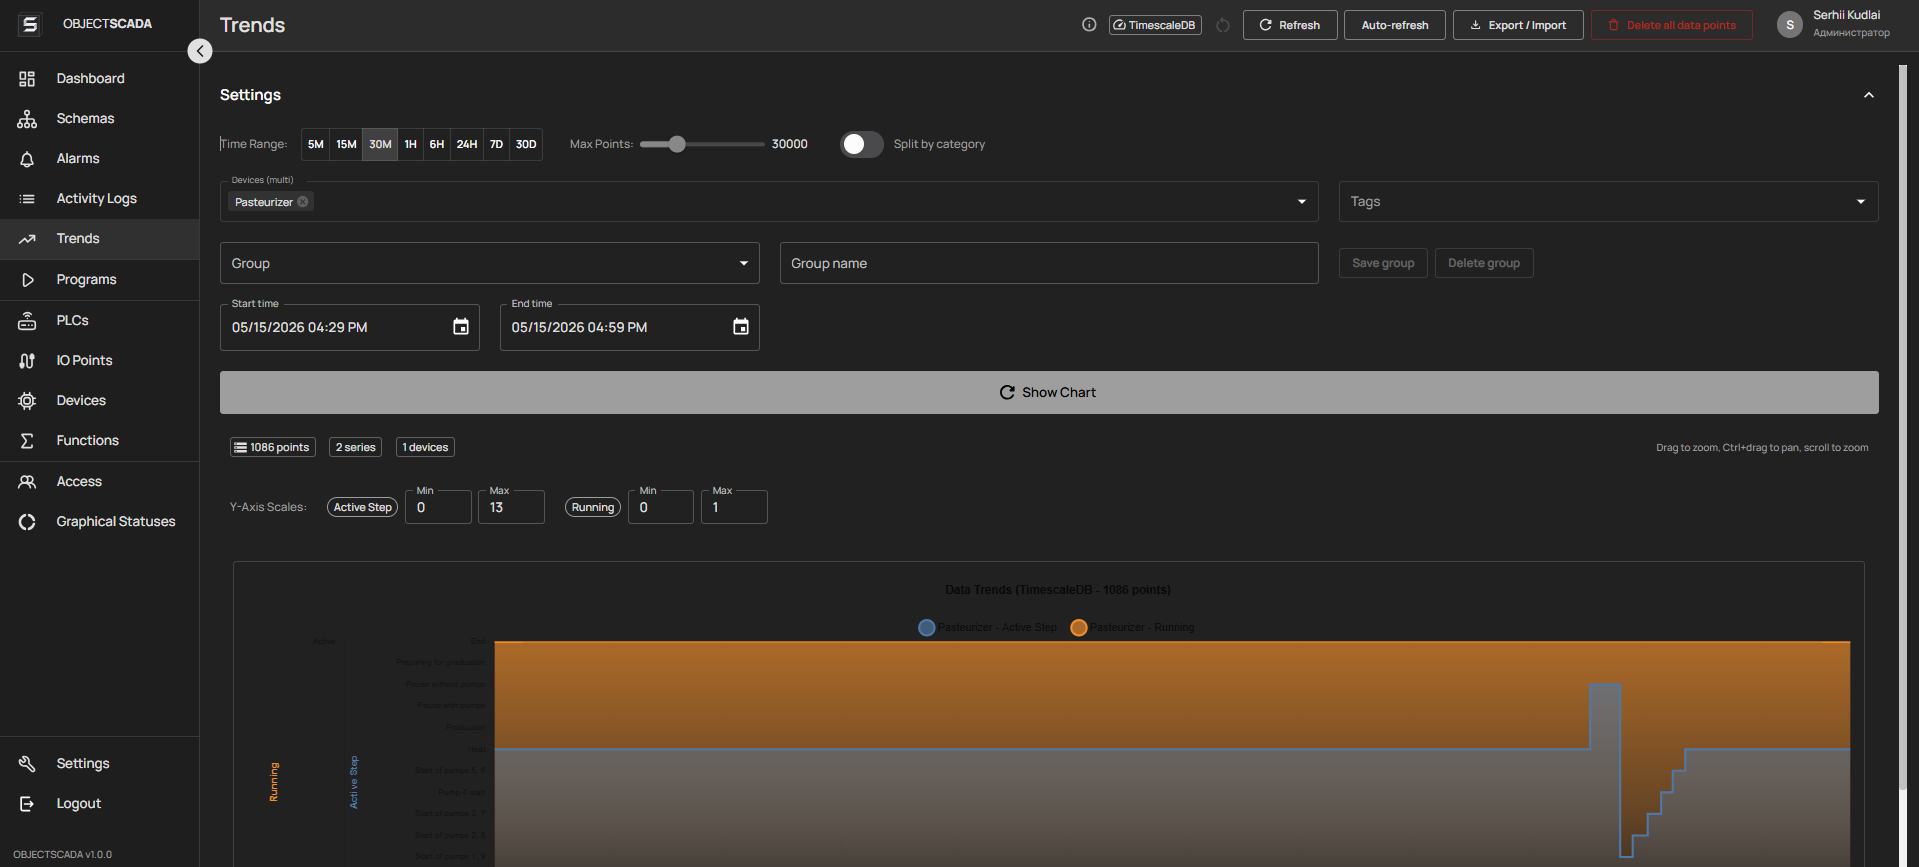
Historical data on a time scale with zoom, multi-parameter comparison and Excel export.
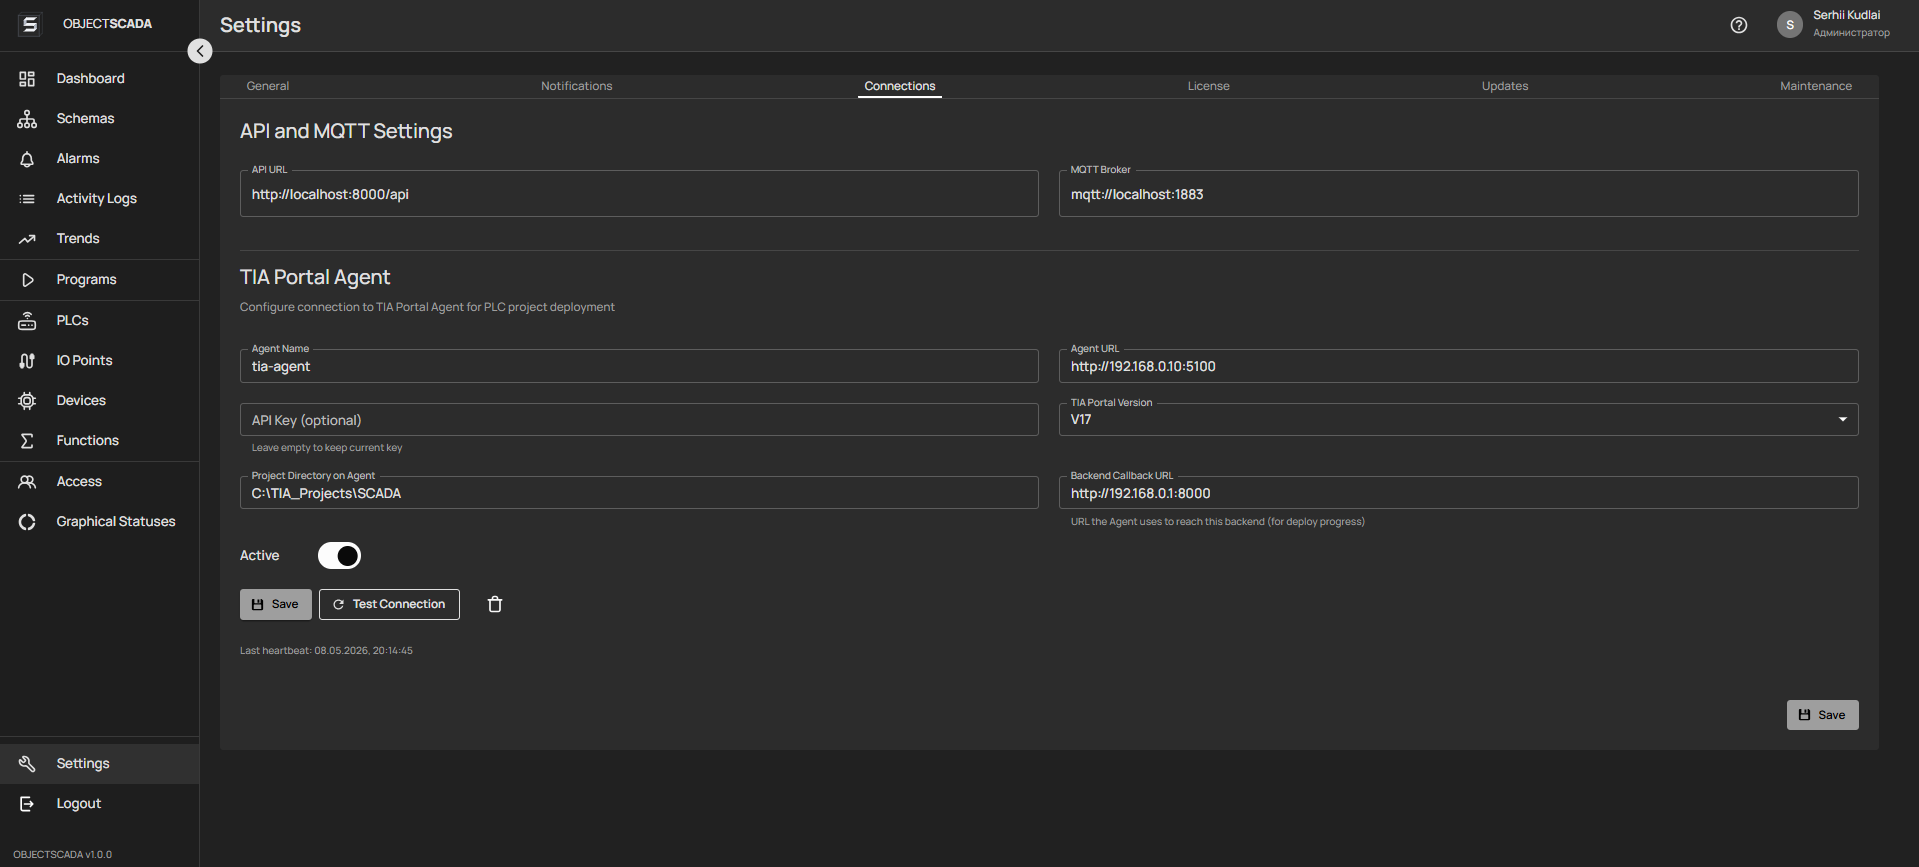
Unified view of links to PLCs, OPC servers and field devices: channel status, diagnostics and connection health.
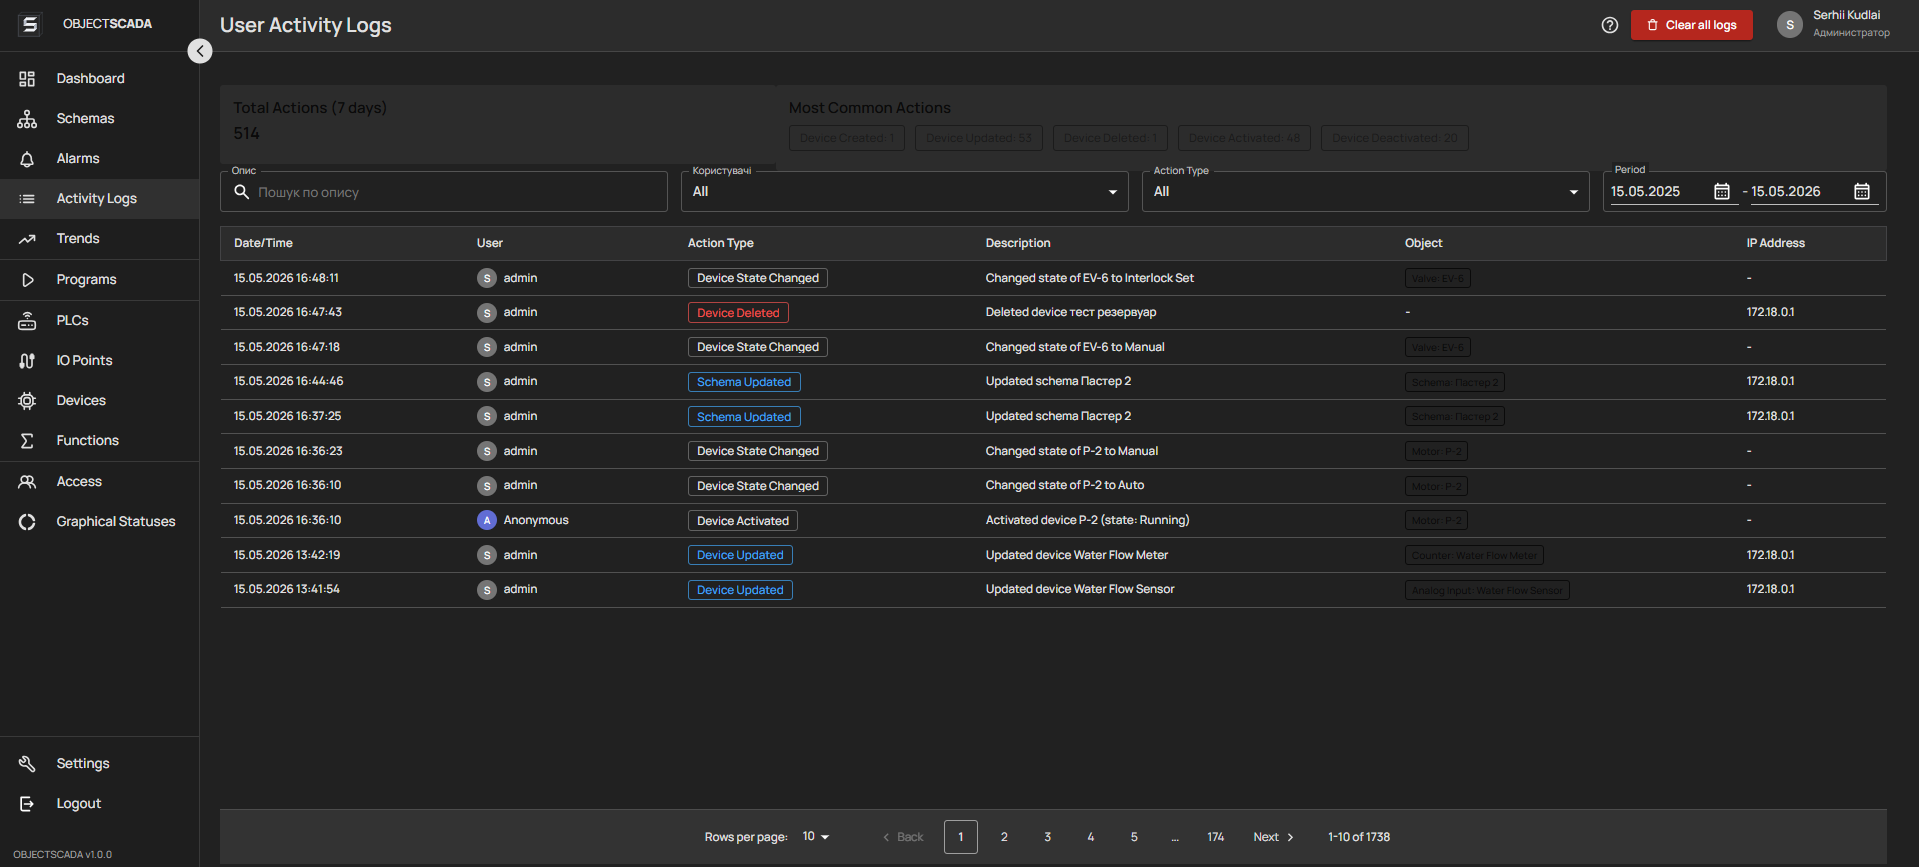
Operator audit trail: who, when and what was done in the system — for investigations and accountability.
Contact us to receive demo access, technical advice or estimate the cost of implementation for your company.